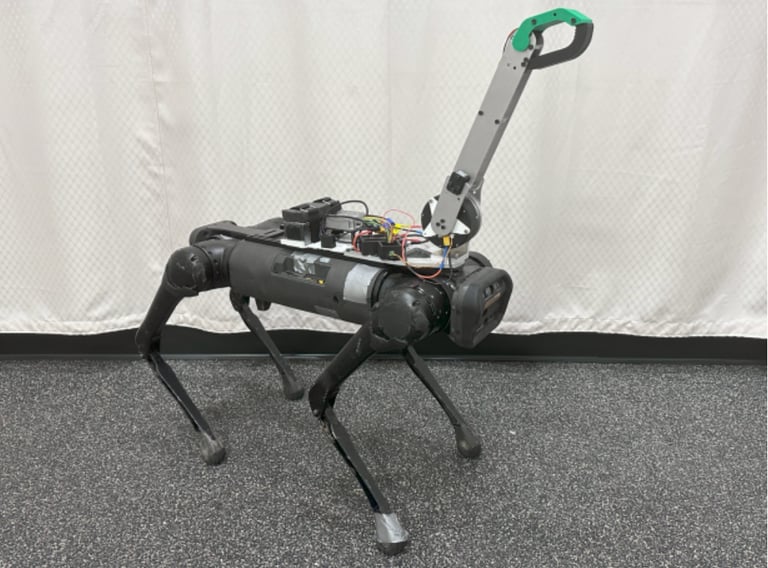
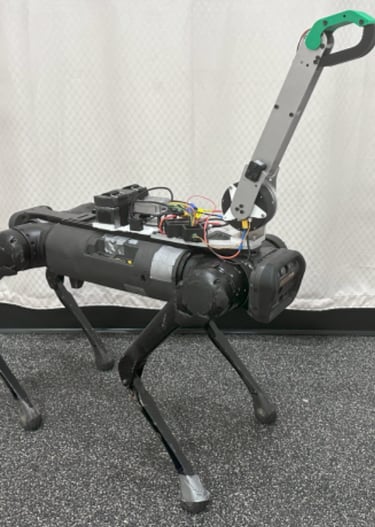
1-dof Quadruped Arm
Motivation
Quadruped robots are highly capable at locomotion, but their usefulness is limited by the lack of an end effector for manipulation. Mounting a full multi-DoF robotic arm is a common solution, but it significantly increases mass, power consumption, and control complexity, often degrading locomotion performance.
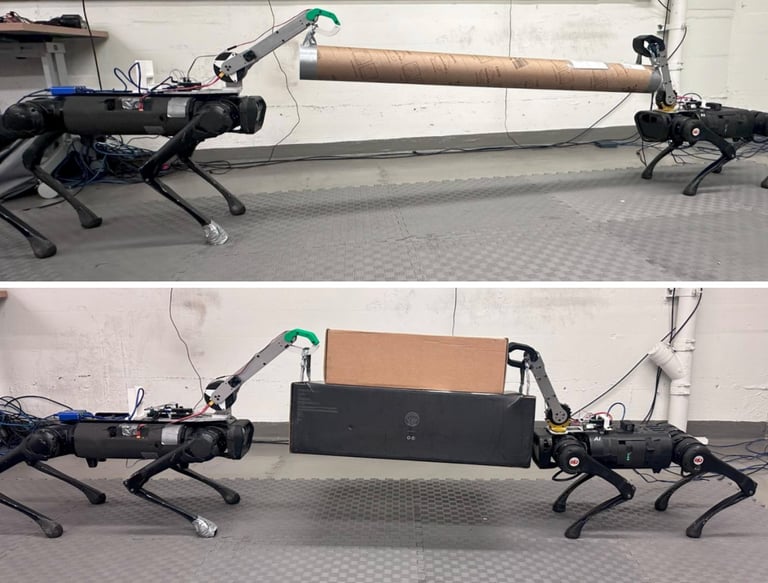
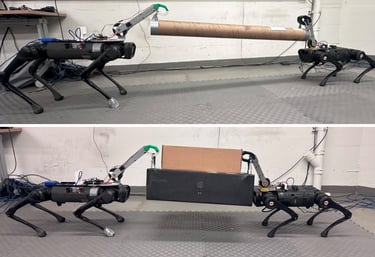
Instead, we explore a minimalistic approach: a lightweight 1-DoF robotic arm that works in coordination with the quadruped’s whole-body motion. Because a quadruped already provides rich 6-DoF body movement, many arm degrees of freedom are redundant. By leveraging coordinated body motion, a simple arm can achieve meaningful manipulation tasks such as lifting, pushing, and carrying heavy objects with far lower cost and complexity. This design emphasizes system-level efficiency—reduced mass, fewer actuators, and tighter integration between hardware and control—while enabling effective loco-manipulation.
Design and System Integration
The 1-DoF arm is built on the same low-level control infrastructure developed for Hector V2, allowing it to integrate seamlessly into the existing quadruped control stack. The arm uses a Unitree A1 joint actuator as the primary pitch joint, providing high torque and reliability in a compact form factor. The arm structure itself is constructed from lightweight laser-cut plates, striking a balance between simplicity, stiffness, and rapid iteration.
A lightweight servo is used to actuate the end-effector gripper, enabling basic grasping and object interaction without adding unnecessary complexity. Both the arm pitch actuator and the gripper servo are fully integrated into Unitree’s software framework, allowing the arm’s pitch angle, velocity, and state feedback to be treated as native control variables alongside the quadruped’s joints.
By reusing a mature low-level control board and real-time firmware, the arm inherits synchronized communication, deterministic timing, and unified command interfaces. This tight hardware–software integration enables coordinated whole-body control, where arm motion and quadruped locomotion are planned and executed as a single system rather than as separate subsystems.
Robots in-motion

Contact
Reach out for internships or collaborations
Phone
junchaom@usc.edu
+1-507-269-9963
© 2025. All rights reserved.